The CS394 Team Diagnostic Tools
There are a couple of tools used in CS 394 to help detect possible issues in a team's development process. These tools are like idiot lights in a car. If they come on, something might be wrong. They don't tell you what's wrong, but normally they should not be coming on.
Gitstats
Gitstats is a CS 394-specific web page that shows the number of commits to the main branch for every team in the current quarter of CS 394. The statistics are calculated weekly by Github for a repository. Github shows this data graphically on the Contributors tab of the Insights page. Note that:
- Statistics are aggregated weekly.
- Only commits to the main branch are counted.
- Commits to branches will show when they are merged to main.
Obviously, commits are a very crude metric. Commits vary enormously in the amount of work included in them. It means nothing if one person has five commits in a week and another has fifteen. But having fewer than two commits in a week is always a sign something happened, such as
- you didn't get a turn to code in any of the swarms
- you didn't use your own machine to code and test
- you worked all week on a branch that is still not done
- you worked all week on a failed experiment
Note: If you don't show up at all on Gitstats, it is usually because your local Git configuration is using an email that is not the one registered with the 394 organization. For how to fix this, see this page.
Bus Factor
The Bus Factor page is a general tool that looks at the history of commits to a repository to identify active files that only one or two team members have worked on.
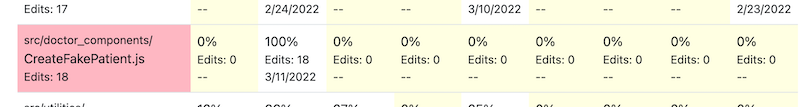
To use it, run the following command in your local repository. Save the output in a local file, e.g., ~/gitlog.txt.
git log --no-merges --name-status main > ~/gitlog.txtThen upload the file generated to The Bus Factor page. See the README for how to interpret the results.
Mood Chart
Team morale and unity are critical to the long-term success of a project, but they are hard to measure. Many team members don't want to admit to being unhappy or unengaged. Many don't like to be put on the spot with questions like "are you happy"? Asking about happiness is probably the wrong question anyway.
A common approach is to have a very lightweight, frequently updated team mood chart, such as a Niko Niko chart. In CS 394, we use a chart developed by Team Blue in the 2020 offering of CS 497 Rapid Software Prototyping.
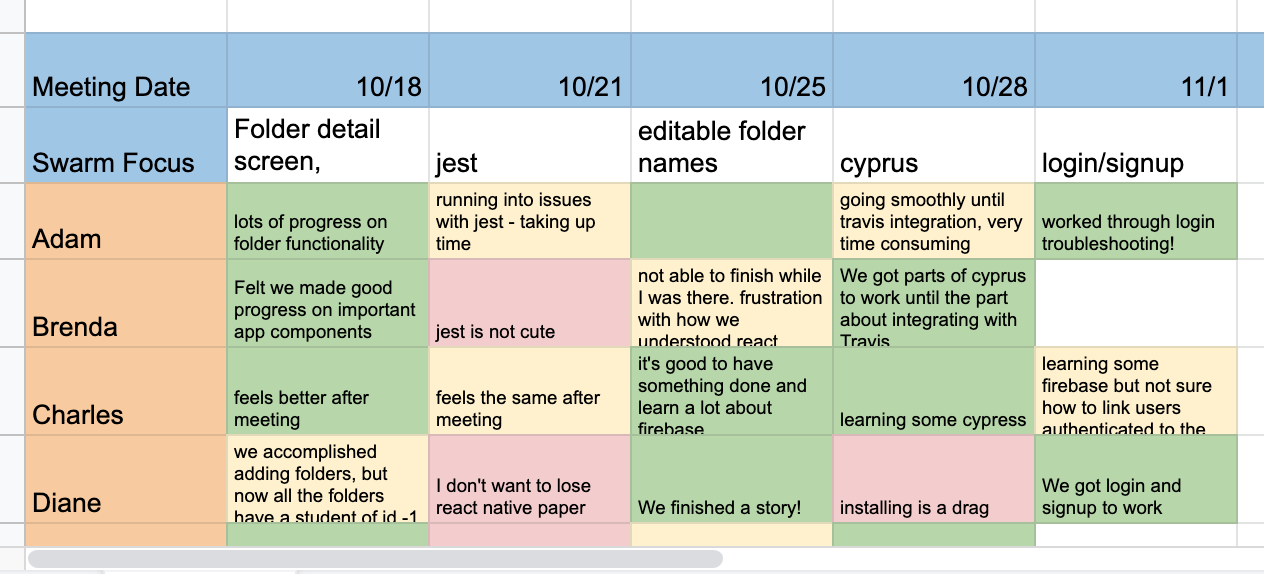
The blocks of colore show mood trends better than yellow smiley faces, and the brief notes give clues to what factors are most affecting the moods of team members.
Make a copy of this chart in your team folder.
To create mood charts that are useful for team improvement:
-
Ritual.
Make updating the mood chart the closing ceremony of each
and every swarm.
- Do not do it weekly. Do not do it "later".
- If it's not done in the moment, it often won't get done, and it definitely won't be accurate.
-
Mood first. Register your mood color first, then reflect before entering
a brief reason.
- Put down how you feel, before seeing what how anyone else felt.
- Then pause and reflect on why you feel that way.
-
Take it personally. How was the swarm
for you, not the project?
- One of the most important things to catch is when the project is going great but some team members feel left behind.
-
Be brief! Enter mood causes
with a short sentence, not a paragraph.
- The goal is to show patterns, e.g., several team members are nervous about the backlog, or feeling like they are not learning anything.
- Examples of good brief mood causes:
- Nervous about doing authentication
- Ben was really patient when we paired
- Took forever to start coding today
- I was really lost doing the CSS modal